What is a Graph Database?
A graph database is a systematic collection of data that emphasizes the relationships between the different data entities. The NoSQL database uses mathematical graph theory to show data connections. Unlike relational databases, which store data in rigid table structures, graph databases store data as a network of entities and relationships. As a result, these databases often provide better performance and flexibility as they are more suited for modeling real-world scenarios.
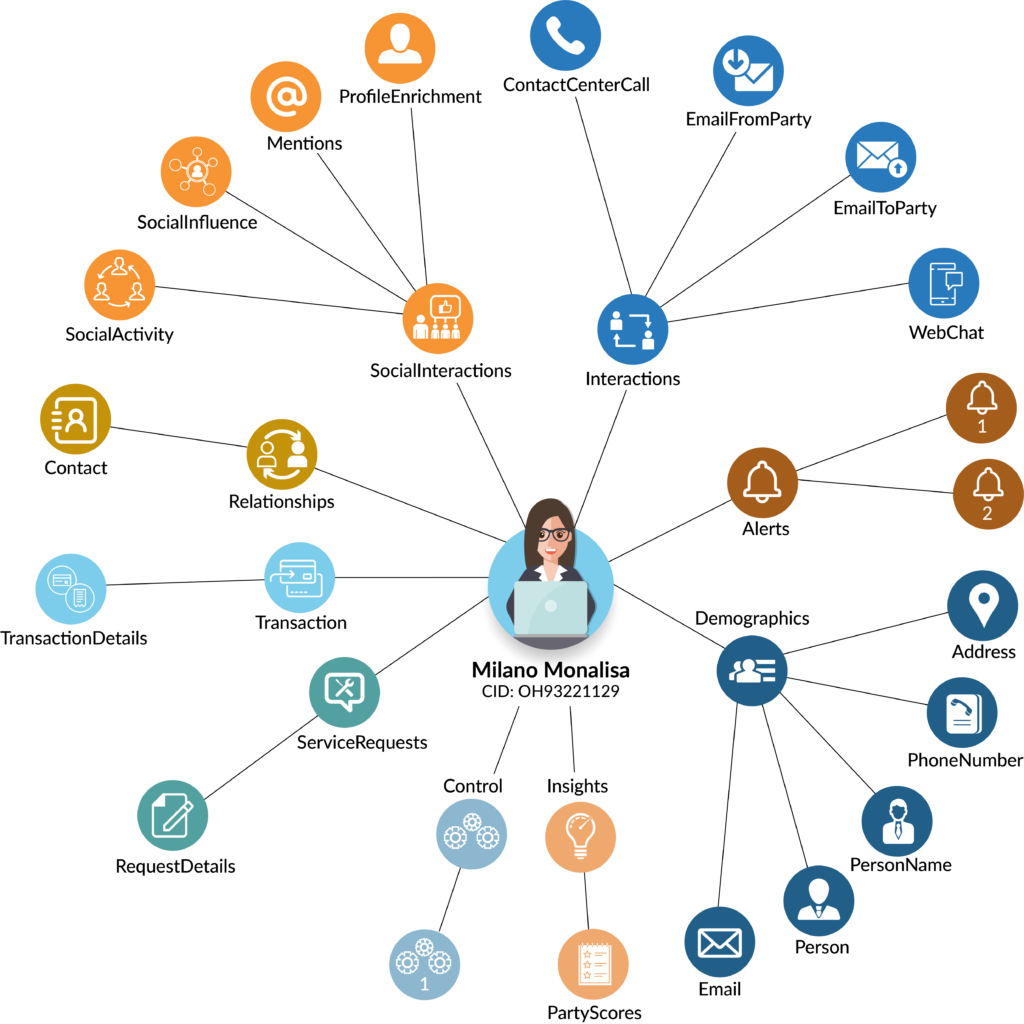
How does the Handisi Graph Data Platform work?
Handisi provides a robust and scalable graph data platform powered by Nebular Graph (a distributed, fast open-source graph database featuring horizontal scalability and high availability). Graph analytics, also called network analysis, is the analysis of relations among entities such as customers, products, operations, and devices. Organizations leverage graph models to gain insights that can be used in marketing or for analyzing social networks.
What are the different types of graph analytics?
- Centrality analysis: Estimates how important a node is for the connectivity of the network. It helps to estimate the most influential people in a social network or most frequently accessed web pages by using the PageRank algorithm.
- Community detection: Distance and density of relationships can be used to find groups of people interacting frequently with each other in a social network. Community analytics also deals with the detection and behavior patterns of communities.
- Connectivity analysis: Determine how strongly or weakly connected two nodes are.
- Path analysis: Examines the relationships between nodes. Mostly used in shortest distance problems.
- Link Prediction: Estimates new relationships or undocumented existence connections by calculating the proximity and structural form of nodes
What are its use cases?
Graph analytics applications exist in journalist, telecom, social networks, finance and operations.
Journalism
A now classic example of using graph analytics to identify networks of relationships is the International Consortium of Investigative Journalists (ICIJ) research on Panama Papers. This research shed light on how authoritarian leaders and politicians used complex sets of shell companies to obscure their wealth from the public.
Armed with graph analytics and document extraction tools, journalists were able to get structured data from thousands of documents on companies in off-shore jurisdictions and use graph analytics to navigate through the structured data in the documents to identify the real owners of these companies.
Compliance
Graph analytics are used to spot frauds or criminals and unlawful actions such as money laundering and payments to sanctioned entities. To detect criminals, analysts use the data of social media, texting, phone calls and emails to create a graph that shows how these data are related to criminals’ records. With that graph, government agencies can identify threats from non-obvious patterns of relationships.
- Financial transactions form graphs and can be analyzed for compliance reasons for example. Banks need to ensure that their customers are not in any way connected to sanctioned entities.
- Loan decisions can be made using social or financial networks.
National security
Though controversial, graph analytics is being used by national intelligence agencies to detect unlawful activity. Communication activity of both suspected and not suspected individuals are collected and analyzed to identify non-obvious relationships and identify potential crimes.
Business Operations
Compliance
Financial entities are required to prevent payments to sanctioned entities and graph analytics are used to spot such payments.
Fraud detection
In businesses that work with networks such as telecom companies, e-commerce marketplaces or financial institutions, graph analytics is used in fraud detection.
Supply Chain Optimization
Graph analytics algorithms such as shortest path and partitioning are tools to optimize routes in airlines, transportation networks, and supply chain networks.
Utility optimization
Companies that provide utilities such as water, sewage services, electricity, dams, and natural gas can leverage graph analysis to build the most optimal utility distribution network.
Marketing
Social Network Analysis
Social media networks such as Instagram, Spotify and LinkedIn are relationship and connection driven applications. Graph analytics helps identify influencers and communities in social media networks. Social network influencer marketing is an emerging trend due to the increasing number of social media network users and increasing customer skepticism with more established forms of marketing.
Recommendation engines
You must have noticed social networks suggesting “People you may know” or “Songs you may like”. These recommendations rely on collaborative filtering which is a method commonly used by recommendation engines. Collaborative filtering relies on graph analytics to identify similar users and enables personalized recommendations.
Technology companies that are not social networks also rely on collaborative filtering. For example, eBay provides the most relevant search results according to purchase history.